


Tools for the Frugal Investor
Research company fundamentals without breaking the bank
A list of inexpensive tools that I have greatly benefitted from over the last 2 years. This is not a comprehensive overview of each tool, just a quick summary of what I use and why.
Marketscreener
What is it
The clue’s in the name – but I don’t use it as a screener in the traditional sense. This is the most useful single page financial overview tool that I use when researching a stock. It shows historical and predicted revue and profit growth, current and next year EV/S for companies, and a whole host of other financial info when you click on the “finance” tab for a stock.
an example
https://www.marketscreener.com/ALTERYX-INC-34336524/financials/
Why I use it
When doing due diligence, I can get a bit lazy and it’s nice to get a ballpark of EV/S, revenue trends, and current balance sheet on a consolidated page.
I also use this to track my virtual portfolio against my actual results.
Cost
Free – there is a nag screen for unregistered users, but that disappears when you create a free account. They have paid options, but I get all I need from the free service.
Koyfin
What is it
A powerful stock research tool. It’s fairly new, and free for now, though a premium service is under development.
Why I use it
My favourite part of Koyfin is the ability to compare the last 12 months (LTM) growth rates of companies that I am interested in. This chart got me really interested in researching LVGO, as an example.

Impressive growth at LVGO, especially when you consider the selected companies for comparison.
Cost
Free (Premium tier in the future)
Stockrow
What is it
Another great web-based screener/summarizer
Why I use it
You can easily get a financial snapshot of a company with up to 10 years of data and indicators like revenue, gross margin, ROE, ROIC, operating cash flow, net income, total debt as like P/E, P/S or EV/FCF.
You get access to quick info on insider transactions from the past 12 months. market cap, enterprise value, EV/EBITDA, quarterly revenue growth rate, margins etc. There is also a CAGR table, that displays the compounded per share growth of sales, cash flows, net income, book value and dividends.
It has a good screener and also provides great tracking of relative performance for companies I follow. No ads is a bonus, even for the free level of access.
This is an overview of the EV/S for some of my portfolio companies (doesn’t cover Canadian stocks like Lightspeed POS)

Cost
Free. Premium edition is ~ £11 a month and gives you
· screening by description
· saving of screeners
· screener export
Webull
What is it
A free web/phone app that I use to track the daily performance of stocks I’m interested in.

Why I use it
I have created a watchlist, and it gives a fantastic daily overview of the gyrations of the companies I follow, by name, percentage gain, etc. I also use to draw lines for technical analysis – much easier on a PC than a phone, but do-able on either!
Cost
Amazingly, this is completely free. It’s excellent and free of ads. Webull has a trading app, but you don’t need a trading account to use the quotes system.
Wallmine
What is it
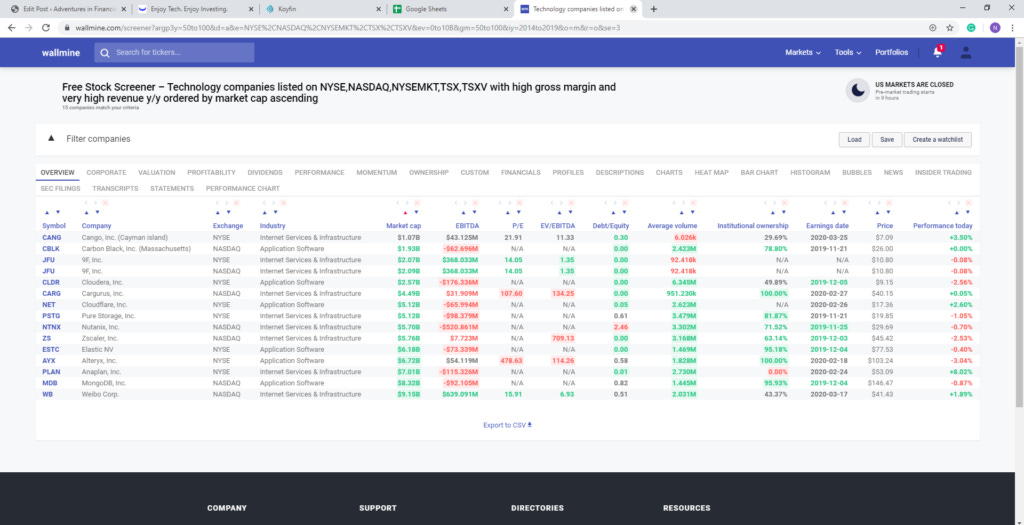
Another great single-page overview of a company with key info including the relevant moving averages, gross profit margin, rev growth, etc.
An outstanding portfolio tracker is included for free.
Why I use it
Wallmine contains a powerful screener, so it’s my go-to place to look for high gross margin companies on a North American exchange, with a market cap under $10B, in the application, software category with revenue growth over 50% per year that IPO’d in the last 5 years, as an example.
I might use wallmine as a public tracker of my investments in the future.
Cost
Free, $50 or $250 a month
The free version covers my needs. Your mileage may vary.
CMLviz
What is it
An ad-free resource from the fine people at CMLpro that gives all the expected information you’d like to see about a stock, but without the noise of Yahoo finance and with a few extra tricks…
Why do I use it
It consolidates technical information like moving averages in a useful chart like so…

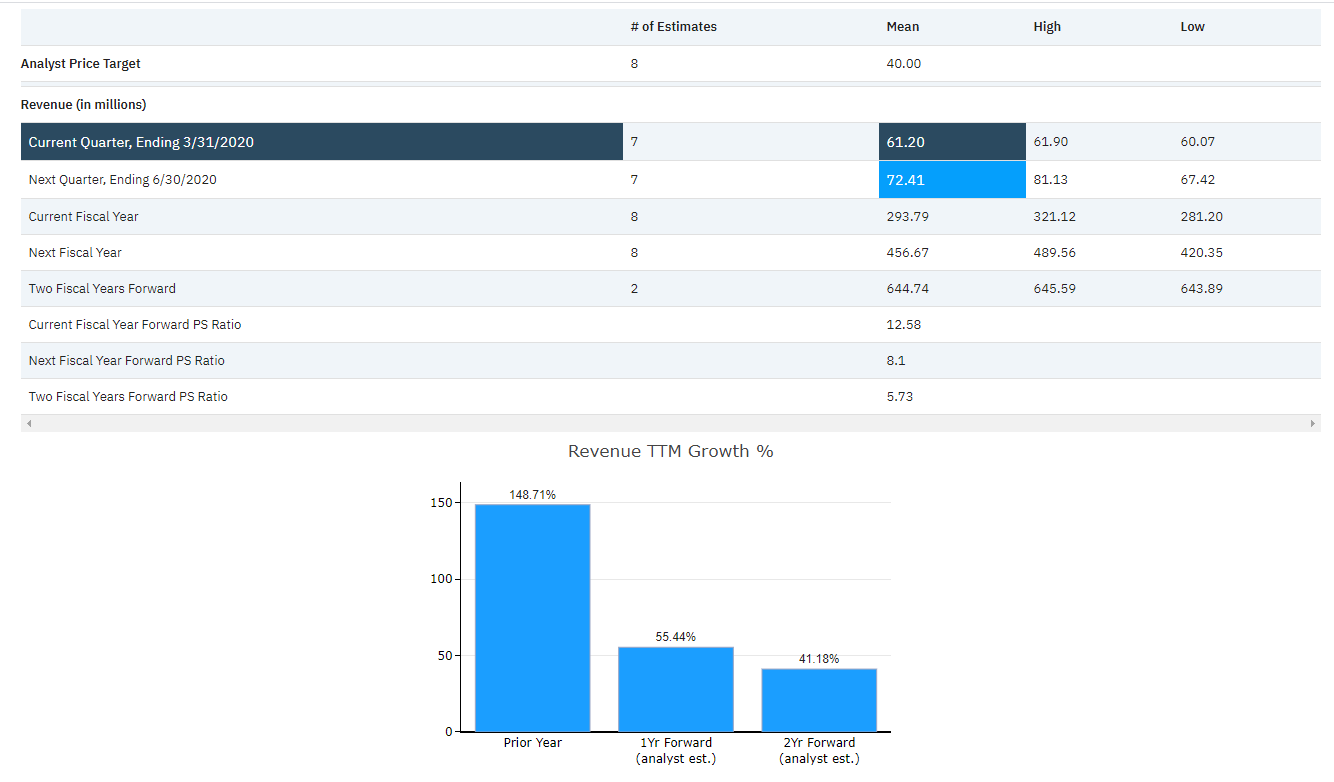
It also gives a P/S prediction 2 years out based on analyst predictions- a feature I have not yet seen anywhere else…
Cost
CMLviz is free.
CML pro research is a monthly subscription service.
Simplywall.st
What is it
A set of tools from an Australian team for those who like to be more visual – it shows you a visual analysis of a particular company on key pre-defined criteria and allows you to look for companies with a similar profile.
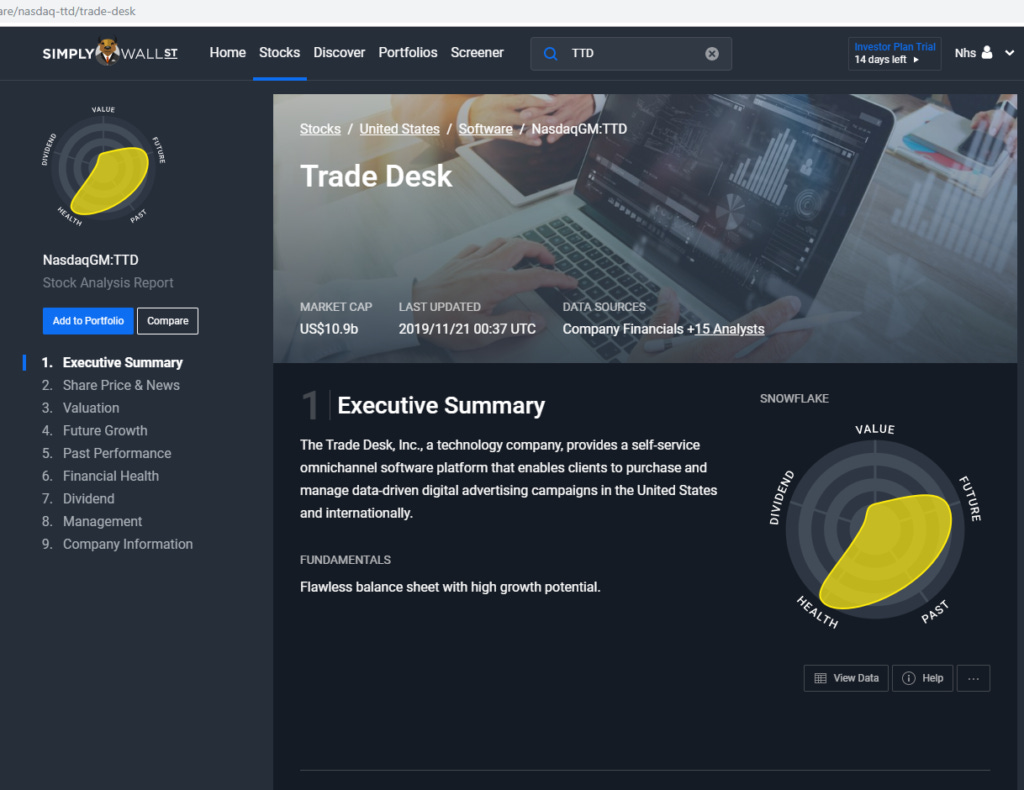
It also gives a visual depiction of when to expect profitability, according to estimates

Why I use it
I love the visual nature of the info and the intuitive interface. It’s a service I am happy to pay for.
Cost
14-day free trial, then £59.50 – £225 per year.
Sharesight
What is it
The best portfolio tracker I’ve come across
Why I use it
To track my portfolio. Integrates exchange rates, shows the financial effect of currency fluctuations and is all-around excellent too that I started using after the demise of the Google finance portfolio tracker. I have a concentrated portfolio and don’t need more than the free service, but paid accounts are £9 – 19 a month.
Seeking Alpha
What is it
A load of over-opinionated guys (and it is largely guys) pontificating on why my stock picks are awesomely overvalued. It’s a source of interesting crowd-sourced financial research by individual investors that have unearthed some good ideas, and there are some outstanding commentators who I respect a great deal.
Why do I use it
There is a variable quality of investing research on Seeking Alpha, but two or three writers are excellent and I find their contributions useful to read. I have also set up a watchlist for my stocks – I find it useful to read articles that touch on stocks that I own, even if I don’t always agree with their conclusions.
It’s a source of ideas, but as always, it’s vital to do your own research.
Cost
Free
Premium subscriptions are USD $19.99 – 29.99 per month
Google Sheets
What is it
A web-based spreadsheet.
Why do I use it
I use it to track my ISA returns, fantasise about the effects of compounding, and work out my debt repayment status. It is the basis of my metrics on the companies that I track.
The Googlefinance function has some nifty tricks!
Cost
Your personal data! – It’s Google after all.
Degiro
What is it
An execution-only broker that gives UK investors access to global markets without ripping them off. Good service, attractive fees, particularly for US stocks, and good mobile app.
No ISA tax-advantaged account offered.
Real-time quotes are annoyingly a paid extra, despite being shown on multiple other free resources I use – a minor annoyance.
Why do I use it
I use Degiro for shorter-term trades and try-out positions and to try to build enough capital to deposit in my ISA. Depending on the quality of the service, Robinhood UK may be a reasonable alternative when it launches.
Cost
Free with cheap commissions, moving to a low rate subscription soon.
Interactive Investor
What is it
This is the 2nd largest UK broker, offering a large set of offerings, including SIPPS and ISAs, trading accounts, and Junior ISAs.
Why I use it
I use it for my ISA.
The subscription model is probably cheaper over the long run than the assets under management fee model of Hargreaves Lansdown for my purposes.
Despite the subscription model, transactions are fairly expensive as you get stung with both a transaction fee and get hit on slightly unattractive currency exchanges in both directions (buying and selling), as all ISA transactions are in GBP. Best for buy and hold LT positions. Not good for short term positions due to the transaction costs.
Cost
Subscriptions are £9.99 to 19.99 per month, then transaction fees and currency exchange fees as listed.